How Sustainable is the Nine-Week Winning Streak for Stocks?
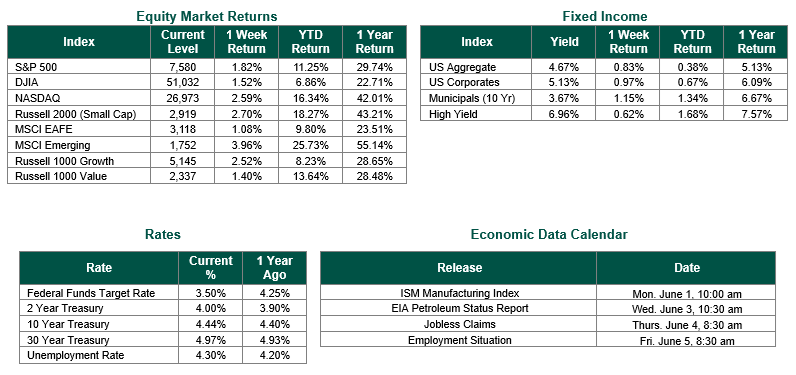
Global equity markets finished positive for the week. In the U.S., the S&P 500 Index closed the week at a level of 7580, representing an increase of 1.82%, while the Russell Midcap Index moved +0.41% last week. Meanwhile, the Russell 2000 Index, a measure of the Nation’s smallest publicly traded firms, returned +2.70% over the week. As developed international equity performance and emerging markets were higher, returning +1.08% and +3.96%, respectively. Finally, the 10-year U.S. Treasury yield moved lower, closing the week at 4.44%.
Equity markets pushed higher again last week, with the S&P 500 advancing 1.8% to log its ninth consecutive weekly gain, the first streak of that length since the nine-week run that ended in December 2023. The S&P 500 rose about 5.3% in May, its second straight positive month, and notched fresh record closes during the week as information technology again did the heavy lifting. The artificial-intelligence infrastructure theme that has defined 2026 remained firmly in control, and NVIDIA extended its leadership into a new product cycle. The Q1 2026 reporting season, now essentially complete with 89% of the S&P 500 having reported, provided additional market tailwinds, with 84% of S&P 500 companies beating consensus earnings per share (EPS) estimates, above both the five-year average of 78% and the ten-year average of 76%. In addition, the blended earnings growth rate for S&P 500 companies climbed to roughly 28%, the highest since Q4 2021. The blended net profit margin also pushed to a record near 14.8%, the highest since FactSet began tracking the metric in 2009, with Nvidia, Microsoft, Apple, Dell, and Intel among the larger contributors to the upward revision in technology earnings since quarter-end. The counterpoint to all of this earnings growth is stock price valuations. The forward P/E of the S&P 500 is now near 21x, above the five-year average of 19.9x and the ten-year average of 18.9x. Fixed income markets stayed on the back foot, with the 10-year U.S. Treasury yield holding in the mid-4.5% area as high inflation and energy price concerns kept a floor under rates.
The labor data continued to describe a stable rather than a strong market. Initial jobless claims rose by 5,000 to 215,000 for the third week of May, slightly above expectations, while continuing claims increased 15,000 to 1.786 million. Both data points remain comfortably below year-ago averages, and the broader reading points to an employment backdrop that is cooling at the margin without cracking. There is enough stability, as several strategists have noted, to give the Fed room to keep interest rates restrictive. Minneapolis Fed President Neel Kashkari underscored that balance on May 28, telling CNBC that he is “focusing heavily on inflation,” and that the labor market is in decent shape, but that inflation is simply much too high.
That inflation problem is the through-line for the week. The re-acceleration of price pressures, driven in large part by the energy shock from the ongoing Iran conflict, has flipped the policy conversation from when the Fed will ease to whether it might have to tighten. Notably, the immediate pressure point eased somewhat during May itself. West Texas Intermediate (WTI) crude oil posted its steepest monthly decline since April 2025, tumbling nearly 17% on hopes of de-escalation, a tailwind for the equity rally. That relief proved short-lived. To start this week, WTI crude oil jumped about 6% back toward $93, and Brent crude oil climbed toward $96 after Iranian state media reported its negotiators were halting communication with the U.S. in response to Israeli strikes on Lebanon. Energy remains the swing factor for both inflation and investor risk sentiment.
The data calendar this week sets the table for the June 16 – 17 FOMC meeting, where, with the Fed Funds Target Rate range holding at 3.50% to 3.75% and the war keeping energy prices unstable, the burden of proof has shifted decisively onto the inflation side of the mandate. The May employment report at the end of this week will be the marquee release, framed by job openings and the ADP jobs print midweek, along with the latest jobless claims and ISM reading. With a nine-week winning streak in the stock market, new record highs, and a forward multiple north of 20x, the market has set a high bar for the incoming data to clear, and short-term bouts of volatility would not be surprising.
Equity and Fixed Income Index returns sourced from Bloomberg on 5/29/26. International developed markets are measured by the MSCI EAFE Index, emerging markets are measured by the MSCI EM Index, and U.S. Large Caps are defined by the S&P 500 Index. Sector performance is measured using the GICS methodology.
Disclosures: Past performance does not guarantee future results. We have taken this information from sources that we believe to be reliable and accurate. Hennion and Walsh cannot guarantee the accuracy of said information and cannot be held liable. You cannot invest directly in an index. Diversification can help mitigate the risk and volatility in your portfolio, but does not ensure a profit or guarantee against a loss.