Mixed Economic Data Leads to More Uncertainty
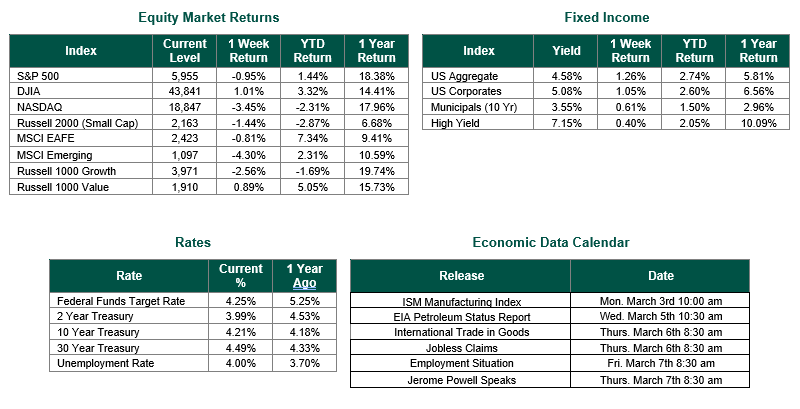
Global equity markets finished mixed for the week. In the U.S., the S&P 500 Index closed the week at a level of 5,955, representing a decline of -0.95%, while the Russell Midcap Index moved down 1.21% last week. Meanwhile, the Russell 2000 Index, a measure of the nation’s smallest publicly traded firms, returned -1.44% over the week. Developed international equity performance and emerging markets were down, returning -0.81% and -4.30%, respectively. Finally, the 10-year U.S. Treasury yield moved down, closing the week at 4.21%.
Last week was a busy week for economic data. Investors received and digested data concerning consumer confidence, new home sales, durable goods orders, GDP, weekly jobless claims, and Personal Income and outlays. Throughout the remainder of this update, we will provide insights into all this data.
The information dump for the week began with a weak Consumer Confidence indication for February. The Conference Board’s Consumer Confidence index was 98.3, while the consensus estimate was looking for 103.0, and the prior month’s level was 105.3. “In February, consumer confidence registered the largest monthly decline since August 2021,” said Stephanie Guichard, Senior Economist, Global Indicators at The Conference Board. This is the third consecutive month-on-month decline.
We also learned last week that sales of new U.S. single-family homes fell more than expected in January as persistently high mortgage rates sidelined potential buyers, providing the latest indication that the housing market and overall economic activity slowed early in the first quarter. The steep decline in new home sales, reported by the Commerce Department last Wednesday, also likely reflected the impact of snowstorms and extremely cold weather in much of the country last month.
Durable goods orders for January 2025 were reported on February 27. The report from the Census Bureau cited a strong increase of 3.1%, exceeding expectations of 2.0%. This reading suggests potential robust business investment due to pre-tariff stockpiling. For comparison, December 2024 saw a modest rise, and this jump indicates an uptick in demand for longer-lasting goods like machinery and vehicles.
Last Thursday, the Bureau of Economic Analysis (BEA) released its first revision of the estimate for fourth-quarter gross domestic product (GDP), which found that the U.S. economy grew at an annual rate of 2.3% in the fourth quarter. Economists surveyed by Dow Jones had been expecting an increase of 2.5% after growth of 3.1% in the third quarter.
Additionally, the Labor Department reported initial jobless claims of 242,000 for the week ending February 22, 2025. This result was above the consensus estimate of 224,000.
Finally, the Bureau of Economic Analysis (BEA) reported last Friday Personal Income and Outlays for January. Personal income increased by $221.9 billion (0.9 percent at a monthly rate), while Personal Consumption Expenditures (PCE) price index increased 0.3% in January after advancing by an unrevised 0.3% in December. Economists had expected the PCE price index to climb 0.3%. On an annual basis through January, prices rose 2.5%, after increasing 2.6% in December. Stripping out the volatile food and energy components, the Core PCE price index gained 0.3% last month after an unrevised 0.2% rise in December. Year on year, core inflation increased 2.6% after climbing 2.9% in December.
Last week’s data painted a mixed picture as GDP and durable goods orders signaled economic strength, buoyed by consumer spending (4.2%). In contrast, rising jobless claims (242,000) and declining consumer confidence and home sales hinted at softening demand. Inflation remained above target, potentially pressuring the Fed to maintain higher interest rates for the time being. Personal income grew modestly, but spending weakened, reflecting caution amid inflationary and labor market shifts. All of this data seems to align with a resilient yet cooling U.S. economy as of early 2025.
Best wishes for the week ahead!
Equity and Fixed Income Index returns sourced from Bloomberg on 2/28/25. Consumer Confidence is sourced from The Conference Board. New Home Sales data is sourced from the Commerce Department. Durable Goods data is sourced from the Census Bureau. Jobless Claims are sourced from the Labor Department. GDP and Personal Income data is sourced from the Bureau of Labor Statistics. Economic Calendar Data from Econoday as of 2/28/25. International developed markets are measured by the MSCI EAFE Index, emerging markets are measured by the MSCI EM Index, and U.S. Large Caps are defined by the S&P 500 Index. Sector performance is measured using the GICS methodology.
Disclosures: Past performance does not guarantee future results. We have taken this information from sources that we believe to be reliable and accurate. Hennion and Walsh cannot guarantee the accuracy of said information and cannot be held liable. You cannot invest directly in an index. Diversification can help mitigate the risk and volatility in your portfolio but does not ensure a profit or guarantee against a loss.