Stocks Surge on Jobs Data and Trade Optimism
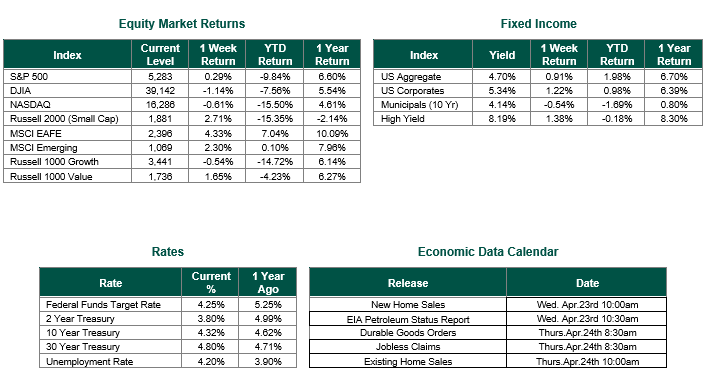
Global equity markets finished positive for the week. In the U.S., the S&P 500 Index closed the week at a level of 5,687, representing a gain of 2.94%, while the Russell 2000 Index, a measure of the Nation’s smallest publicly traded firms, returned 3.24% over the week. Developed international equity performance and emerging markets were also strong, returning 3.18% and 3.38%, respectively. Finally, the 10-year U.S. Treasury yield moved up, closing the week at 4.31%.
Last week, the U.S. stock market staged a robust recovery, erasing April’s losses and extending winning streaks for the major stocks-oriented indices. For example, the S&P 500 has now closed higher for eight consecutive days – its longest winning streak since August 2024. Fueled by a strong jobs report, easing trade tensions, and solid corporate earnings, the market rallied, though underlying economic concerns and uncertainties linger. Key sectors like financials, transportation, and technology (notably certain semiconductor/chips companies) led the charge, bolstered by several of the three previously mentioned catalysts:
• Corporate Earnings: Technology giants Microsoft and Meta delivered strong earnings on April 30, alleviating concerns about artificial intelligence (AI) spending and tariff-related costs. These reports lifted investor confidence and helped support broader market gains.
• Trade Optimism: Reports that China was open to trade negotiations, coupled with President Trump’s hints at reducing tariffs, countered earlier market fears sparked by April’s initial tariff announcements.
• Jobs Data: The U.S. economy added 177,000 jobs in April, surpassing expectations of 133,000, with unemployment steady at 4.2%. This resilience eased worries about a severe economic slowdown, at least for the time being.
Despite last week’s gains, April had been volatile, with the S&P 500 dropping 11% at its lowest point due to tariff uncertainties. While the stock market celebrated, the broader economy sent mixed messages, highlighting both strengths and vulnerabilities. These messages included, but were not limited to, the following:
• GDP Contraction: The U.S. economy shrank by 0.3% in Q1 2025, the first decline since 2022. A surge in imports, as businesses stockpiled goods ahead of tariffs, masked weaker consumer spending, which slowed to 1.8% – the lowest level of spending since mid-2023.
• Labor Market Dynamics: The strong jobs report was tempered by a spike in weekly jobless claims to 241,000. This uptick raised concerns about potential cracks in the labor market.
• Inflation and Fed Outlook: Inflation showed signs of cooling in March, but tariffs are expected to drive prices higher over the short term. With the Federal Reserve’s benchmark rate still at 4.25%–4.5%, markets anticipate no immediate changes at the upcoming meeting, though we would not be surprised to see the first rate cut of 25 Bp (0.25%) take place following the June FOMC meeting. Overall, investors have scaled back expectations to three quarter-point rate cuts in 2025, according to the CME Group – which is still one rate cut more than the most recent “Dot Plot” chart from the Federal Reserve suggests.
• Trade Policy Uncertainty: President Trump’s tariff policies, announced in early April, continued to create ripples. While some firms reported losses and lowered 2025 guidance, optimism grew after signals of potential tariff relief and China’s willingness to negotiate.
The market’s rally reflects resilience in the face of economic headwinds, but the GDP contraction and rising jobless claims underscore fragility. The tariff-driven import surge may have exaggerated certain Q1 2025 figures, and the full impact of trade policies on inflation and growth remains uncertain. The Federal Reserve’s cautious stance balances inflation risks against slowdown fears, and upcoming decisions will be pivotal. As markets navigate tariff uncertainties and economic crosscurrents, the focus will shift to the Fed’s next moves and progress in U.S.-China (as well as certain other large countries) trade talks.
Best wishes for the week ahead!
Equity and Fixed Income Index returns sourced from Bloomberg on 5/2/25.GDP Data sourced from the Bureau of Economic Analysis on 4/30/2025. Jobs data sourced from the Bureau of Labor Statistics on 5/2/25 Economic Calendar Data from Econoday as of 5/5/25. International developed markets are measured by the MSCI EAFE Index, emerging markets are measured by the MSCI EM Index, and U.S. Large Caps are defined by the S&P 500 Index. Sector performance is measured using the GICS methodology.
Disclosures: Past performance does not guarantee future results. We have taken this information from sources that we believe to be reliable and accurate. Hennion and Walsh cannot guarantee the accuracy of said information and cannot be held liable. You cannot invest directly in an index. Diversification can help mitigate the risk and volatility in your portfolio but does not ensure a profit or guarantee against a loss.