Uncertainty Increases Market Volatility
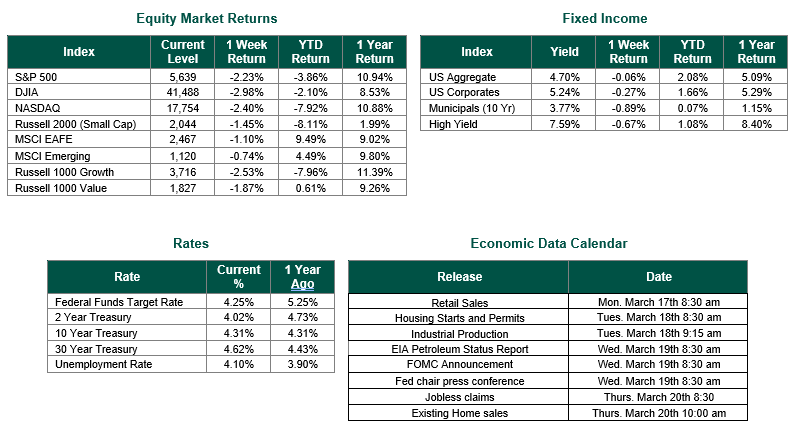
Global equity markets finished lower for the week. In the U.S., the S&P 500 Index closed the week at a level of 5,639, representing a decline of -2.23%, while the Russell Midcap Index moved – 1.50% last week. Meanwhile, the Russell 2000 Index, a measure of the Nation’s smallest publicly traded firms, returned -1.45% over the week. Developed international equity markets and emerging markets also declined, returning -1.10% and -0.74%, respectively.
Finally, the 10-year U.S. Treasury yield remained flat, closing the week at 4.31%.Market volatility was the story of the past week as investors continued to deal with the uncertainties caused by ongoing geopolitical events and the effects of the current Administration’s tariff policy. Additionally, investors were provided with new economic data concerning employment, inflation, and consumer sentiment. We will provide our readers with analysis and insights into all this data.
The latest snapshot of job openings in the US shows that there were 7.74 million available positions at the end of January, signaling renewed optimism from US employers to start the year. The number of job openings rose from December’s downwardly revised total of 7.51 million, according to the latest Job Openings and Labor Turnover Survey released Tuesday by the Bureau of Labor Statistics.
The Bureau of Labor Statistics reported Wednesday that prices for goods and services moved up less than expected in February, providing some relief as consumers and businesses worry about the looming impact tariffs might have on inflation. The Consumer Price Index (CPI), a wide-ranging measure of costs across the U.S. economy, ticked up a seasonally adjusted 0.2% for the month, putting the annual inflation rate at 2.8%, according to the Labor Department agency. The all-item CPI increased 0.5% in January.
Weekly Initial claims for unemployment benefits slipped 2,000 to a seasonally adjusted 220,000 for the week ended March 8, the Labor Department said on Thursday. The consensus estimate had forecast 225,000 claims for the latest week. Looking forward there is a fear that sharp government spending cuts and an escalating trade war could threaten labor market stability.
Also on Thursday, the U.S. Bureau of Labor Statistics reported that the Producer Price Index (PPI) for final demand was unchanged in February, seasonally adjusted. The index for final demand advanced 3.2% for the 12 months ended in February.
Consumer sentiment took another hit in March as worries intensified over inflation and a slumping stock market, according to the University of Michigan’s latest sentiment survey released Friday. The survey posted a reading of 57.9, which represents a 10.5% decline from February and was below the Dow Jones consensus estimate of 63.2. The reading was 27.1% below a year ago and was the lowest since November 2022.
The week’s data painted a mixed picture of the U.S. economy. JOLTS and jobless claims pointed to a robust labor market, exceeding or meeting expectations, while CPI and PPI indicated a cooling of inflationary pressures, with results generally softer than anticipated. These trends could provide the Federal Reserve with flexibility to adjust monetary policy if economic conditions weaken, though persistent labor strength might delay rate cuts. Consumer sentiment, pending full data, likely reflected ongoing uncertainty, influenced by both inflation relief and broader policy concerns. Compared to prior results, inflation moderated, but labor market resilience held firm, shaping a complex outlook for markets and policymakers.
Best wishes for the Week ahead.
Equity and Fixed Income Index returns sourced from Bloomberg on 3/14/25. JOLTS, CPI and PPI data are sourced from the Bureau of Labor Statistics. Jobless Claims are sourced from the Labor Department. Consumer Sentiment is sourced from the University of Michigan. Economic Calendar Data from Econoday as of 3/14/25. International developed markets are measured by the MSCI EAFE Index, emerging markets are measured by the MSCI EM Index, and U.S. Large Caps are defined by the S&P 500 Index. Sector performance is measured using the GICS methodology.
Disclosures: Past performance does not guarantee future results. We have taken this information from sources that we believe to be reliable and accurate. Hennion and Walsh cannot guarantee the accuracy of said information and cannot be held liable. You cannot invest directly in an index. Diversification can help mitigate the risk and volatility in your portfolio but does not ensure a profit or guarantee against a loss.