Big Tech Stumbles as Market Leadership Broadens
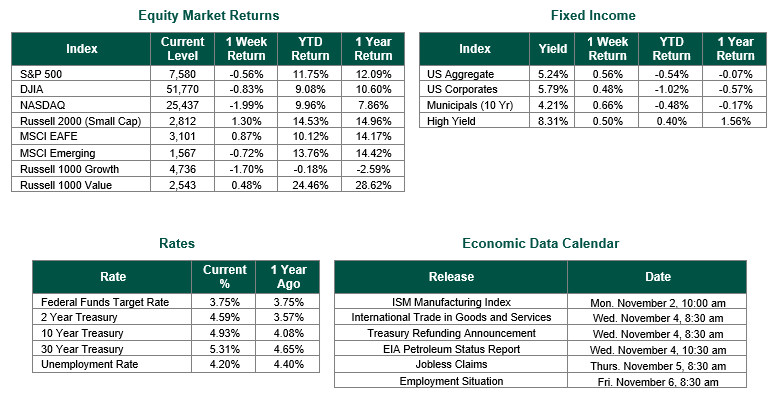
Global equity markets finished mixed for the week. In the U.S., the S&P 500 Index closed the week at a level of 7580, representing a decrease of 0.56%, while the Russell Midcap Index moved +0.52% last week. Meanwhile, the Russell 2000 Index, a measure of the Nation’s smallest publicly traded firms, returned +1.30% over the week. As developed international equity performance and emerging markets were mixed, returning +0.87% and -0.72%, respectively. Finally, the 10-year U.S. Treasury yield moved lower, closing the week at 4.93%.
Last week brought the heaviest run of 3RD quarter earnings reports from the largest technology companies, and the results put artificial intelligence (AI) spending back at the center of investor concerns. Through Wednesday, the S&P 500 was on pace for a solid weekly gain. That all changed on Thursday and Friday, as disappointing results from Alphabet, Amazon, and Intel pulled the Nasdaq Composite down nearly 2% for the week and left the S&P 500 with its third straight weekly decline. However, beneath the headline numbers, the picture was much healthier. Nine of the eleven S&P 500 sectors finished higher, small caps gained 1.30%, and the Russell 1000 Value Index outpaced the Russell 1000 Growth Index by more than two percentage points.
Demand was not the problem in certain mega-cap earnings reports. Cloud growth was exceptional across the board: Microsoft’s Azure revenue grew 48%, Amazon Web Services grew 39%, and Google Cloud revenue more than doubled. Spending was the apparent issue. Alphabet spent $51.4 billion on capital expenditures in the quarter, well above the $42.3 billion it generated from operations, and missed estimates for both revenue and earnings. The stock fell 12.6% on Thursday, erasing roughly $500 billion of market value. Amazon’s quarterly capital spending of $77.3 billion ran far ahead of expectations, and management said it expects to spend meaningfully more in 2027. Microsoft was the exception, pairing faster Azure growth with positive free cash flow. On Friday, Intel fell 28.6%, its worst day in decades, amid a weak fourth-quarter outlook, and the Nasdaq Composite fell 2.86%, its worst session since June. Financing is now part of the story as well. Meta filed on Monday to raise approximately $95 billion in new stock. As we noted two weeks ago, the AI buildout is increasingly funded with outside capital, which raises the bar for the returns this amount of spending must eventually deliver.
Outside of the largest names, earnings remain strong overall, and we see that as the more important takeaway from the week. According to FactSet, with 60% of S&P 500 companies reporting, 82% have beaten EPS estimates, and the blended earnings growth rate for the third quarter is 30.2%, which would mark a third straight quarter of y-o-y earnings growth above 25%. What stands out is where the growth is coming from. The blended growth rate for the “Magnificent 7” has fallen to 22.6% from 33.6% at the end of September, while growth for the other 493 companies in the index has risen to 32.6% from 27.8%. If those figures hold, it would be the first quarter since the fourth quarter of 2022 in which the Magnificent 7 grew earnings more slowly than the rest of the index, though GAAP charges at Alphabet and Meta explain part of the gap. Sector returns told the same story. Health Care led with a 3.12% gain on earnings beats from companies such as Eli Lilly and Elevance Health, while Communication Services fell 5.32% and Technology slipped 2.03%. Energy rose 1.00% as tanker attacks in the Strait of Hormuz pushed Brent crude back to $117.70 a barrel on Friday. In our view, a market that can absorb a rough week for its largest members while most stocks move higher is showing healthy breadth, not fragility.
The Federal Reserve held the federal funds rate at a target range of 3.75% to 4.00% on Wednesday, as expected. However, two members, Governor Lisa Cook and Cleveland Fed President Beth Hammack, dissented in favor of another 25-basis-point hike. The FOMC statement said economic activity is expanding at a strong pace and that inflation remains elevated, and Chair Warsh declined to commit to a path for the December 9 meeting. Thursday’s data did little to settle that debate. Real GDP grew at a 3.4% annualized rate in the third quarter, up from 2.2% in the second quarter, while the September PCE price index rose 0.5% for the month and 3.6% from a year ago, with core PCE at 3.1%. Bonds rallied as investors moved into U.S. Treasuries during the tech selloff. The 10-year yield fell to 4.93%, and the 2-year yield dropped to 4.59%, while the Bloomberg U.S. Aggregate Bond Index gained 0.56%, municipal bonds returned 0.66%, and high yield added 0.50%.
This week brings a full calendar of data releases. Apple reports earnings after the close on Monday, the midterm elections are on Tuesday, and roughly 140 S&P 500 companies are scheduled to report. For perspective, the S&P 500 has been higher one year after each of the 19 midterm elections since 1950, with an average price gain of about 15%. Of course, this time could be different. On the data side, the ISM Manufacturing Index will be released on Monday, the Treasury’s quarterly refunding announcement on Wednesday will draw attention with the 10-year yield still near 5%, and Friday brings the October jobs report. September payrolls rose by just 29,000 with unemployment at 4.2%. Hence, another soft reading could test the Fed’s potential appetite for a December rate hike.
Best wishes to all for the week ahead!
Equity and Fixed Income Index returns sourced from Bloomberg on 10/30/26. Corporate earnings data are sourced from FactSet. GDP and PCE data were sourced from the Bureau of Economic Analysis on 10/29/26. Future interest rate probabilities are sourced from CME Group FedWatch. Midterm election returns are based on S&P 500 Index price data since 1950. International developed markets are measured by the MSCI EAFE Index, emerging markets are measured by the MSCI EM Index, and U.S. Large Caps are defined by the S&P 500 Index. Sector performance is measured using the GICS methodology.
Disclosures: Past performance does not guarantee future results. We have taken this information from sources that we believe to be reliable and accurate. Hennion and Walsh cannot guarantee the accuracy of said information and cannot be held liable. You cannot invest directly in an index. Diversification can help mitigate the risk and volatility in your portfolio, but does not ensure a profit or guarantee against a loss.